

- Drag the “Region” field to the text in the Marks card
- Drag the “Order Date” field to the filter shelf and select “Month/Year” and then click on “Next”
- Select the “Use all” radio button from the filter pop up window and then click “Ok
- Right-click on the data filter and then select “Show Filter” so that the user can select the desired month
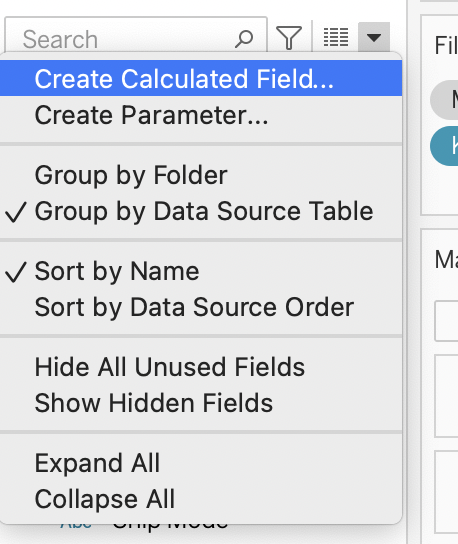
- Click on the down arrow in the data pane and choose “Create Calculated Field” and then name the calculation as “KPI Region”
- Enter the following calculation in the calculation editor
- WINDOW_MAX(SUM([Sales]))=Sum([Sales])
- Drag the “KPI Region” calculated field to the filter shelf and select “True” and then click”Ok”
- Click on the text in the Marks card and then increase the size of the text and change the alignment to centre
- Go to the “Format” menu and then select “Font”
- Click on the “Shading” from the Format Font pane and then select desired worksheet colour